In this release, I will attempt to talk about importance and relevance of accounting and how it can be a crucial step in decision making for businesses.
Accounting Process:
- Typical accounting process involves categorising transactions as per their nature and classifying them which puts them in profit and loss and balance sheet.
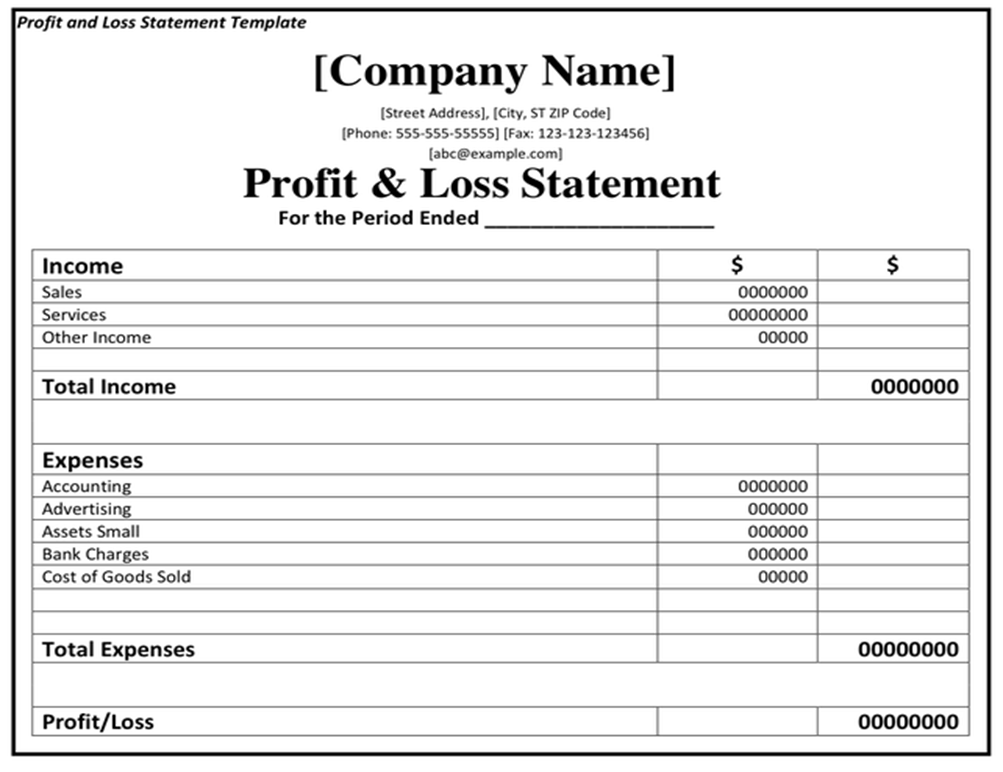
- Profit and loss statement: Once this process is done, profit and loss statement looks like this. It explains financial result for the business of that period. It tells us how much money a business is making and what all areas it is spending on to make that money.
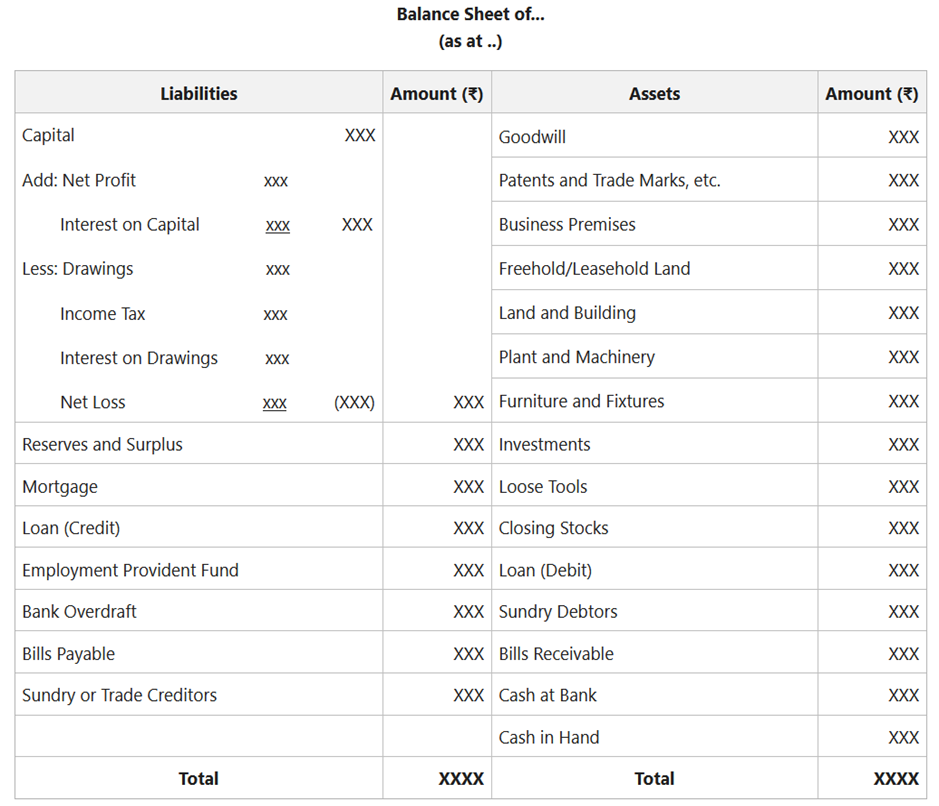
- Balance Sheet: It tells us financial position of any business and answers questions like how much money business has in free cash and other assets, what amount it owes to external people, how much money belongs to the owners of the business, etc. When compared over period, it also tells us how money generated by business is utilised by it. Balance sheet looks like this.
What can we do with Profit/Loss statement and Balance sheet?
- Specific period: Profit/loss and balance sheet tells us about financial results and financial position of any specific period but it gives us a lot more sense when it is compared over multiple periods.
- Comparison: When this statements are compared over multiple periods, it answers many important questions such as:How much sales has grown?Has margin % grown over the years?Has cost growth been in proportion to sales growth?Has collection from receivable been good?What business has done with money generated over years?
Amongst others.
I try to highlight and put out here few sample data and charts and ratios that we could generate using set of financial data which helps business owners in better decision making.
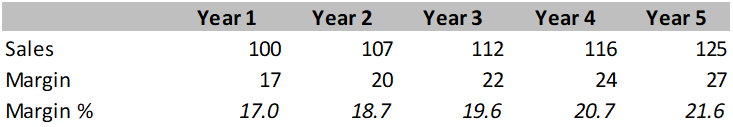
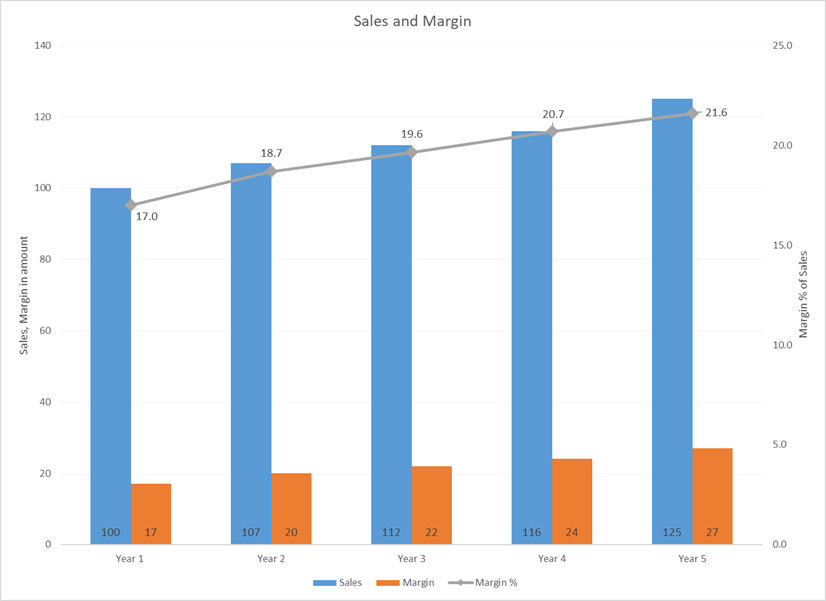
Sample Data 1:
Explanation:
Margin as percentage of sales gives you a better sense of trends and is first step to look into factors that are determining. Usually, at a start of business, margins are lower due to high fixed costs and as sales rises and fixed costs remains same, margins rises a bit relative to sales. After this level, margins rises primarily due to two factors, costs controls and higher pricing in sales.
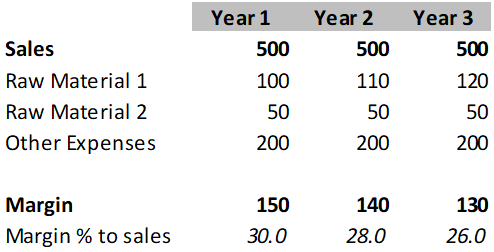
Sample Data 2:
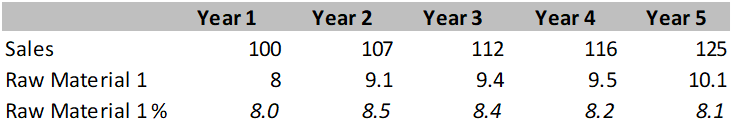
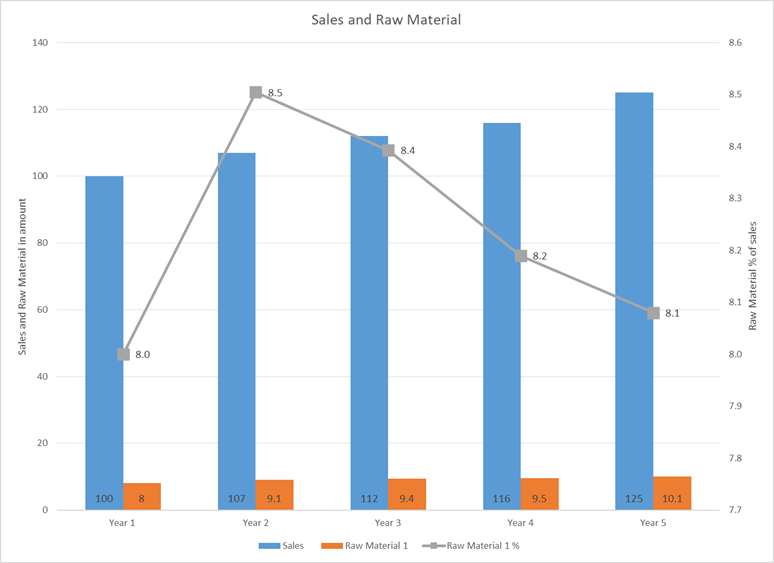
Explanation:
Table and data here indicates trend of any raw material or expense as percentage of sales, and can be very important to gauge the impact of it on margins. When it rises as percentage of sales, it can be either due to rise in raw material prices or downward pressure on sales price, both impacting margins negatively.
Sample Data 3:
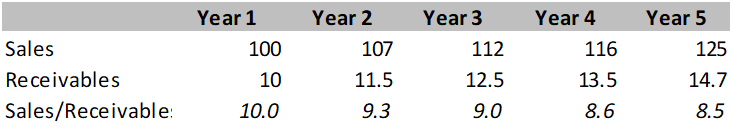
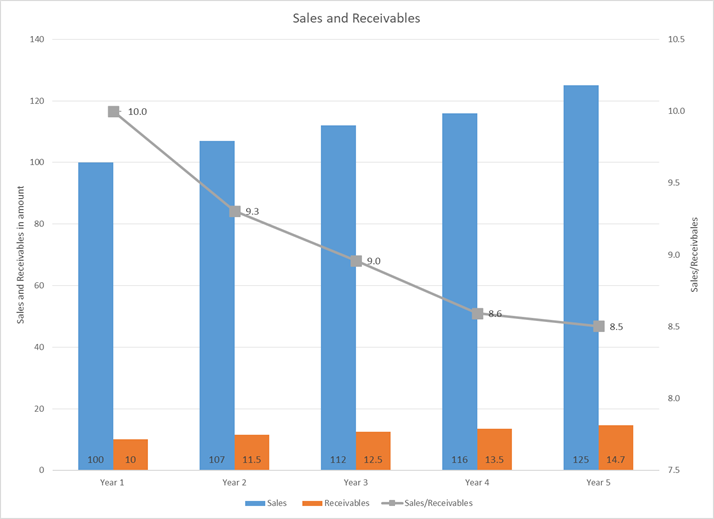
Explanation:
Sales/Receivable ratio is used to indicate quality of receivables. For example, in year 1, sales/receivable is 10x and declines to 8.5x in year 5, it means receivable collection is not good, and one rupee is receivable is generating lesser sales and business might be giving higher credit period to boost sales.
Sample Data 4:
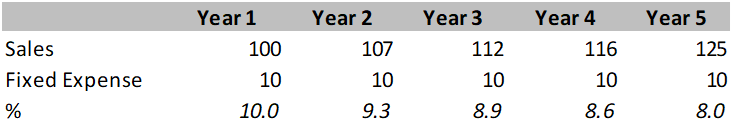
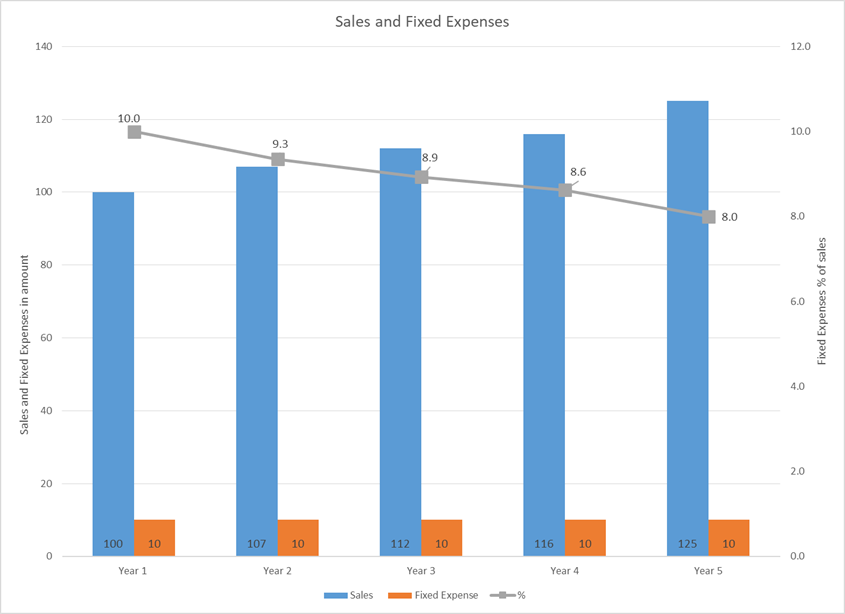
Explanation:
Fixed expenses are high in initial years of business usually, relative to sales. As sales rises, fixed expenses are constant for a certain level of sales and it declines as % of sales, which results in higher margin. Here, in the sample data, from year 1 to year 5, 2% decline in fixed expenses results in higher margin.
Sensitivity analysis:
Explanation:
Table indicates scenario indicates impact of change in one of the expense on margins keeping other factors constant. For instance, increase in raw material 1 by 10% in year 2 results in decline in margin of 2%.
Disclaimer: This article is intended to give very rudimentary sense of accounting and reports/ratios that one could use. It is not in any way intended to cover all aspects nor advises readers to do any decision making solely based on the aspects covered here, for which the author can in no way be held responsible for.